🦠 COVID-19 | A second spike is coming
I am a scientist by education, banker at JPMorgan for a few years, then mature PhD student in Chemical Biology at Oxford under the supervision of Christofer Schofield (FRS) and Peter Ratcliffe (Nobel laureate in medicine in 2019). Founder and tech investor focusing on media and education. I care about science, learning and Democracy which are good bedfellows.
📊 Daily Data Brief: (May 28, 2020, 15:26 GMT)
Cumulative case: 5,833,755 (+135,105) cumulative cases
Active cases: 2,948,459 (+46,088) (this is the number of currently infected patients)
Total Deaths: 358,424 (+5,948)
Serious/Critical Cases: 53,009 (-116)
Recovered: 2,526,872 (+83,069)
Source: Worldometers
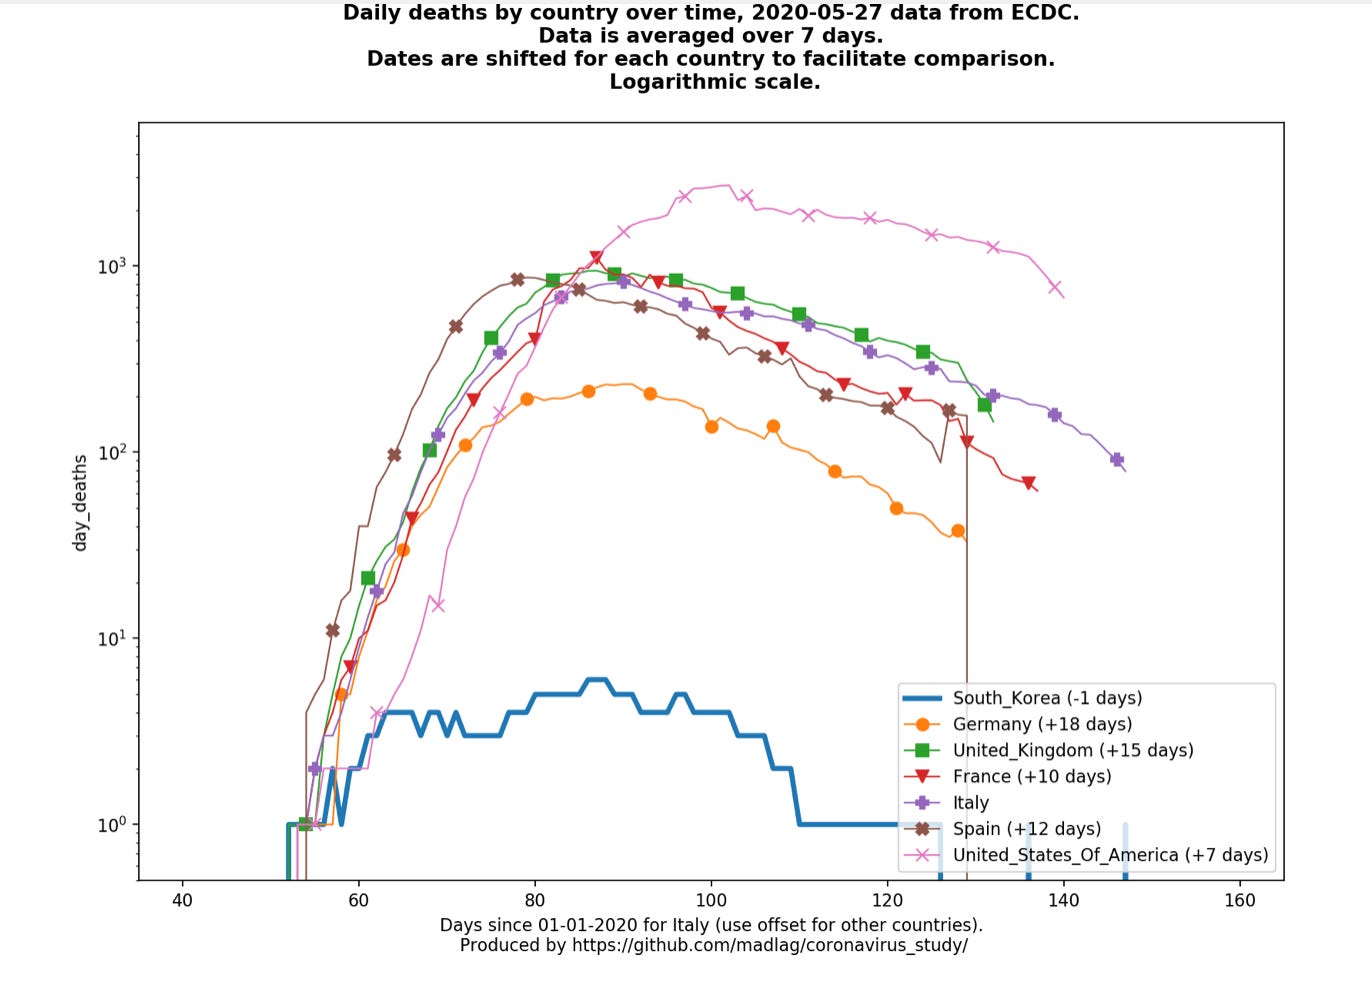
1) Seven-day rolling average of new deaths (updated daily as ECDC releases). Major update with per country graphs now available (Link) (US, UK, France, Germany, Sweden, Nordic Comparison)
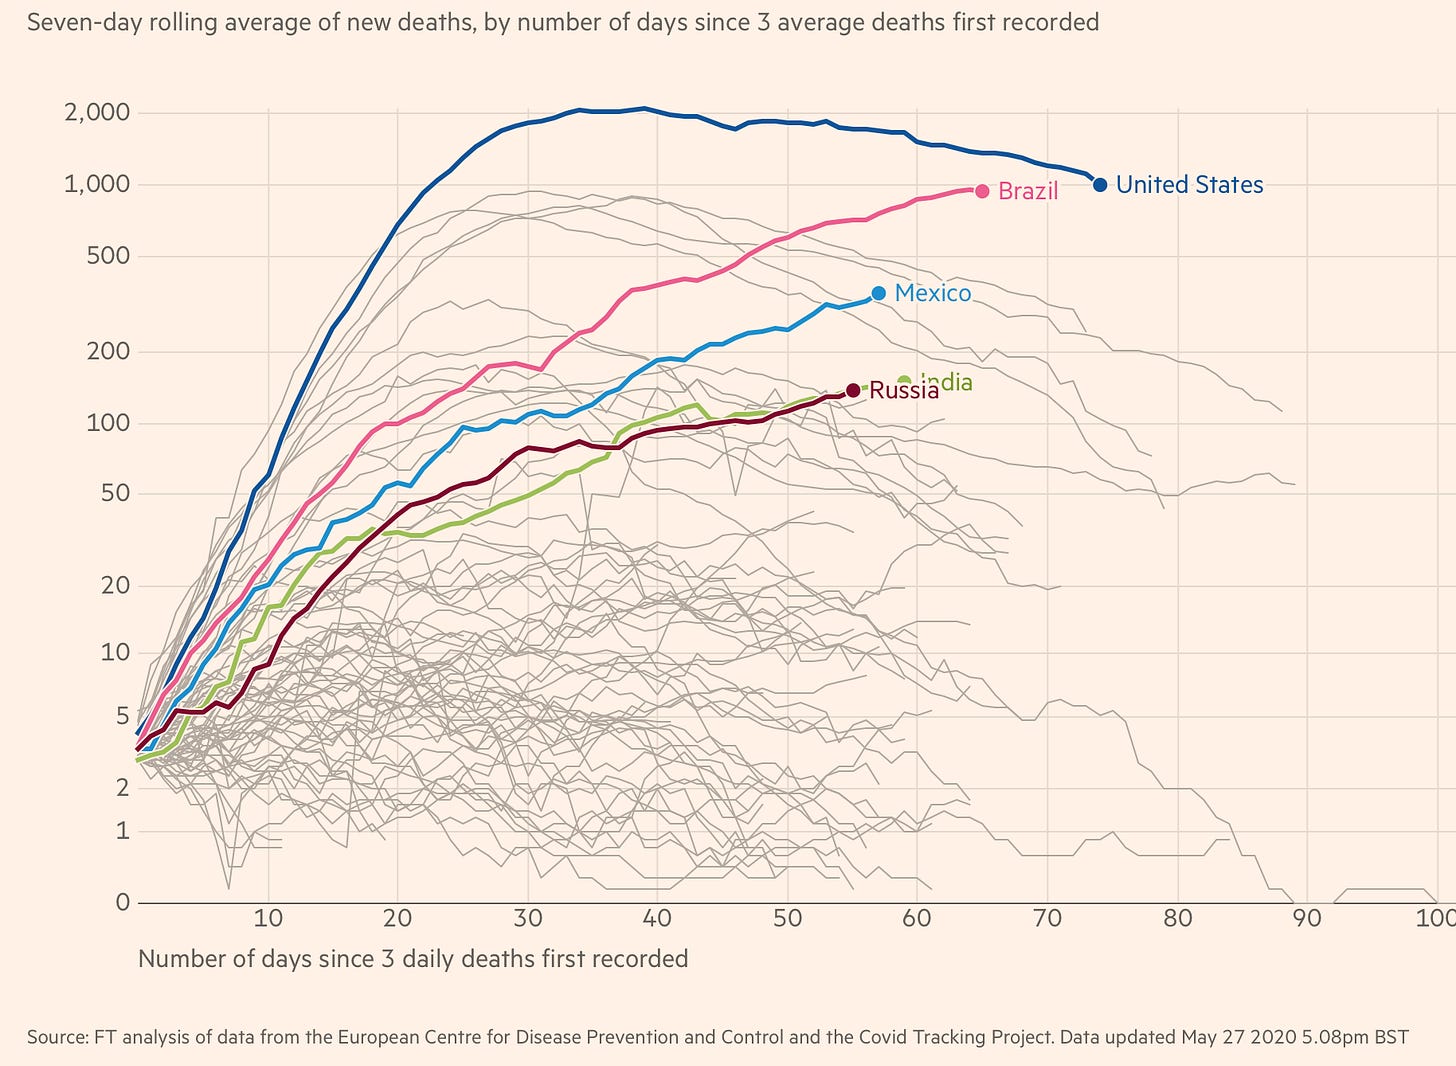
Showing a chart from the FT today highlighting the worrying situation in Brazil, Mexico, India and Russia. Also the FT comparative charts now allow up to 6 countries
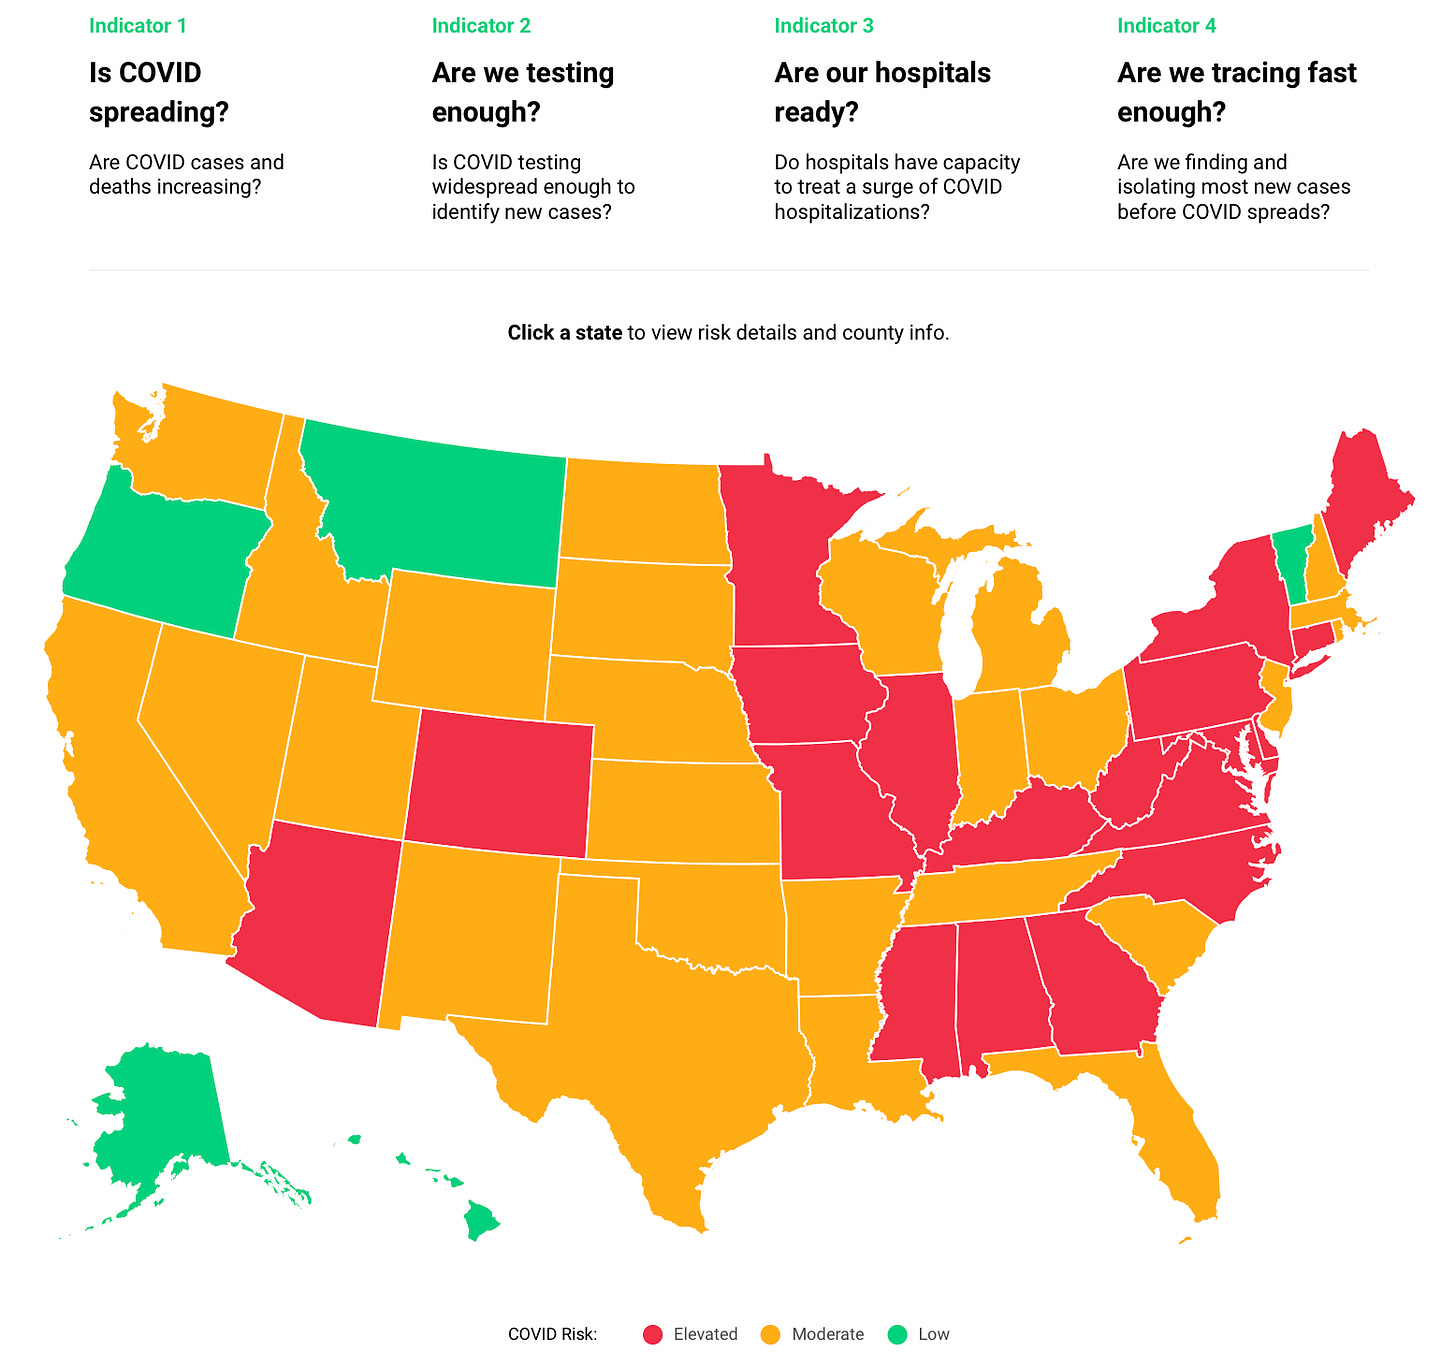
2) U.S. states reopening risk map: this analysis includes current estimated R (reproduction number) for each state (Link) (NEW❗️4th indicator added)
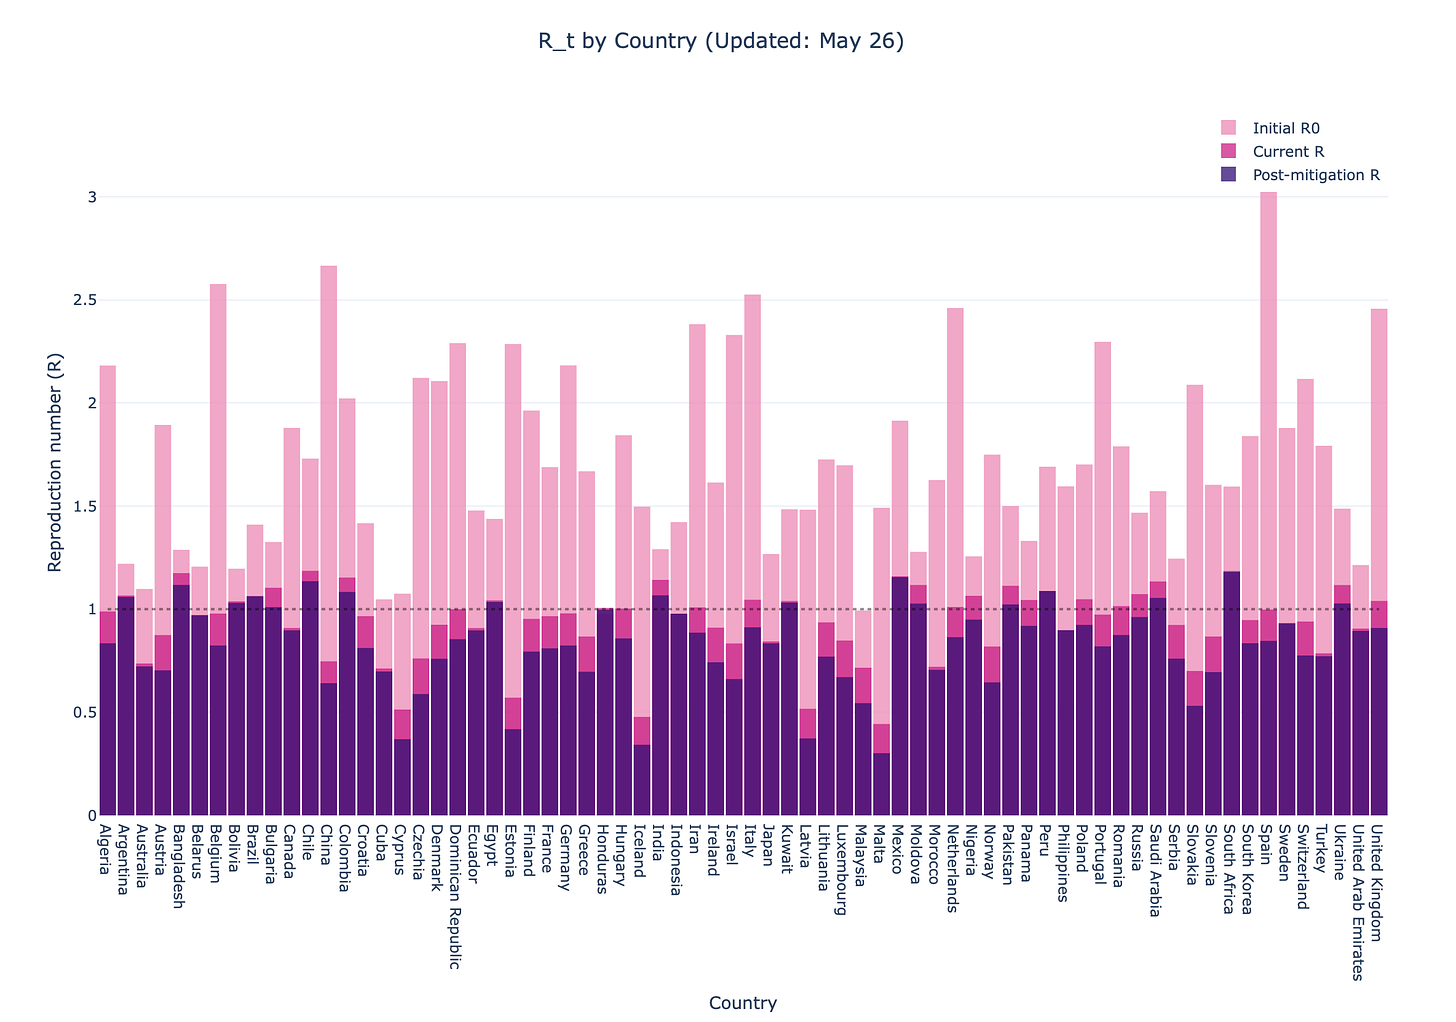
3) Rt estimate per country (NEW❗️). This is a new resource link in the data section from a team which has led accuracy in modelling fatalities in the US for the past few weeks. (Link)
A second spike is coming. South Korea, with first class testing-tracing-isolating capacity just suffered a new outbreak (article below) and it is likely that other countries will experience the same as they re-open.
The second spike will likely be more localised than the first one, and we have learned a lot in treating patients during the first wave. However in most places re-opening will increase transmission risk even though the adequate testing-tracing-isolating infrastructure is not yet in place. Furthermore, although we have learned more about super-spreader events, we still need more data to refine re-opening policy. It was impossible to gather such data whilst in lock-down, and we are consequently left with finding out with more cases and deaths. It is an unfortunate situation to say the least.
One of the areas which will require particular care is protecting the elderly. This is today’s short Video of the day.
The Thread of the Day re-inforces the need to increase testing-tracing-isolating not only to contain the virus but also to be more intelligent going forward about our re-opening policy. There is a great article in Science on the need for universal masking whilst we learn more about airborne transmission of respiratory diseases.
The Food and Drug Administration in the US has been criticised for halting a study in the Seattle area which could have provided helpful data for public policy.
An article in the Washington post reporting on new census data on prevalence of anxiety and depression in the US. The mental health cost has been underreported and is rising significantly.
Two articles on the negative news flow out of Moderna after having been in the spotlight last week. The rally it had triggered than in the stock market has not receded, but Moderna’s share price is definitely off its high.
Finally, an interview of the Editor-of-Chief of Science. As “25% of Americans have been convinced by bots and cable news that they shouldn’t trust science”, there is still work to be done to better educate and increase the public trust in science.
👵 Video fo the day: A short video on “Protecting the elderly in COVID-19” by the World Economic Forum, looking at what countries which have been successful have done, and what we should do in case of we suffer a second spike or second wave (2 min 17 sec)
🦠 Thread of the day: Adam Kucharski (associate professor at London School of Hygiene and Tropical Medicine) writes a thread reminding us of “The importance of testing and contact tracing” in light of a new pre-print paper published this week. (Link)
As Kucharski writes in the first tweet:

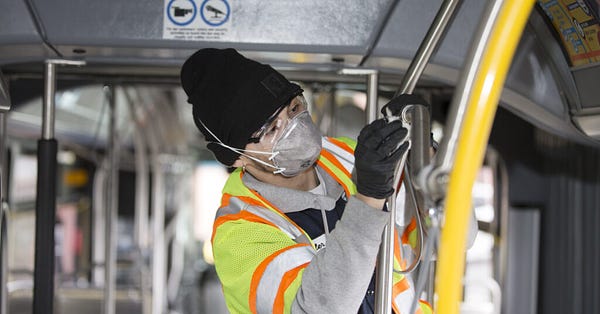
Michael Worobey et al. who published “The emergence of SARS-CoV-2 in Europe and the US” on the pre-print BioRxiv write in their abstract:
“Our analyses reveal an extended period of missed opportunity when intensive testing and contact tracing could have prevented SARS-CoV-2 from becoming established in the US and Europe.”
As Kucharski writes at the end of the thread, in assessing re-opening we should not only look at case numbers, but also understand that the more open we are the more we expose ourselves to the risk of flare-ups. In the meantime we will need to better our understanding of SARS-CoV-2 transmission routes:

🇰🇷 Justin McCurry writes “South Korea could face return to coronavirus restrictions after spike in new cases” in The Guardian. There has been a new outbreak in South Korea following the one in the ‘gay district’. This time the spread originated in a distribution centre near Seoul, owned by e-commerce firm Coupang. As a result the authorities have decided to close parks, museums and art galleries.
In a way, South Korea, given its robust testing-tracing-isolation capacity, is able to not only contain this outbreaks but also provide valuable data to countries around the wold about the transmission routes of the virus. This will be valuable information for countries around the world for refining their reopening policies. (Link)
😷 Kimberly A. Prather et al. publish “Reducing transmission of SARS-CoV-2” in Science. This article looks at modes of transmission of the virus, and in particular from asymptomatic individual, and how best to reduce them:
“For society to resume, measures designed to reduce aerosol transmission must be implemented, including universal masking and regular, widespread testing to identify and isolate infected asymptomatic individuals.”
It provides a good explainer on aerosol versus droplet transmission with a helpful infographic reproduced below:
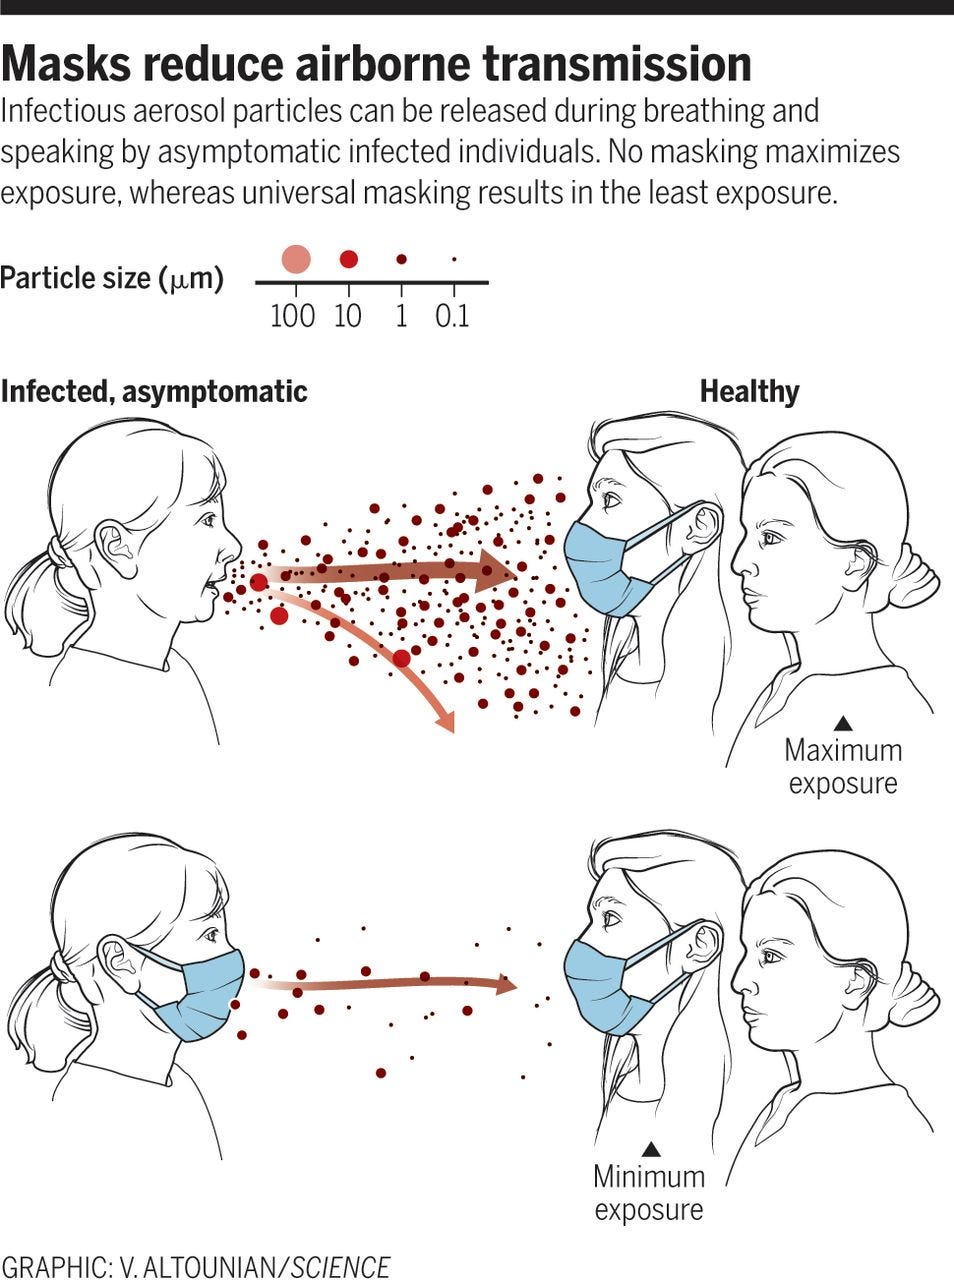
The article argues for supplementing robust testing-tracing-isolating infrastructure with universal masking based on empirical data from other countries:
“From epidemiological data, countries that have been most effective in reducing the spread of COVID-19 have implemented universal masking, including Taiwan, Hong Kong, Singapore, and South Korea.”
Finally, the authors acknowledge that more research is needed on aerosol and droplet transmission of respiratory diseases. As New York taxis used to say with regards to road safety “buckle up”. When it comes to respiratory diseases, it is “mask up”. (Link)
🧪 Erin Brodwin writes “Experts decry FDA’s halting of a high-profile Covid-19 study over approvals” for STAT news. The FDA has halted the Bill Gates backed effort to study the spread of COVID-19 in the Seattle area using at-home testing. In doing so, the agency cited two regulatory shortcomings of the Seattle Coronavirus Assessment Network (SCAN) study: a federal emergency use authorization and an ethical oversight board.
Experts are critical of the FDA decision, and in particular the lack of clarity on its authorisation framework preceding this decision, or maybe its lack of preparedness to design and communicate a clear policy surrounding this type of studies. The U.K. has had a similar guidance recently from the MHRA (Medicines and Healthcare products Regulatory Agency) regarding at-home antibody tests.
The SCAN study is looking to re-apply to resume its study. The data will be helpful to better understand transmission routes and refine public policy. (Link)
😨 “A third of Americans now show signs of clinical anxiety or depression, Census Bureau finds amid coronavirus pandemic” for the Washington Post. The mental health of the crisis is often under-reported. The article and the census work provide valuable information. Unfortunately mental health capacity has also been underfunded prior to this pandemic.
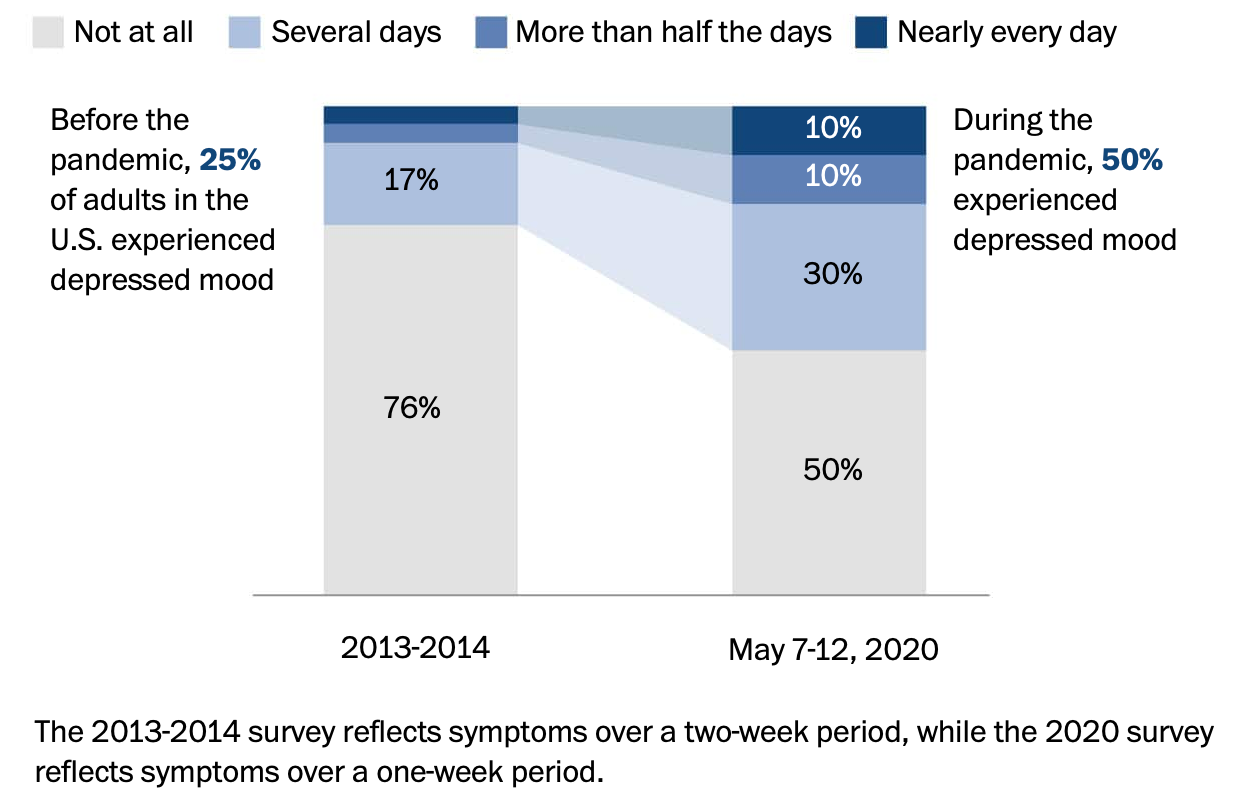
The prevalence of the clinical anxiety and depression, is more present in the younger and more economically vulnerable populations. Some might say it is counterintuitive given that fatality rates amongst younger people is lower, but the level of unemployment and the resulting financial stress are known to be important triggers for both depression and anxiety. (Link)
💉 Moderna has had more worrying news coming out this week and its stock price has suffered. First Damian Garde wrote “Moderna executives have cashed out $89M in shares this year, as stock price has soared on vaccine hopes” in STAT news. Surprisingly the Chief Medical Officer now has zero shares in the company. We should be able to confidently look to him for future updates given that he has no upside from the stock going up in the future… (Link)
Matthew Herper previously wrote about a patient on the Phase 1 trial receiving a high does of the vaccine and developing high fever and hospital care: “He experienced a severe reaction to Moderna’s Covid-19 vaccine candidate. He’s still a believer”.
It is a reminder if needed that the road to a vaccine remains to be travelled and is full of pitfalls. (Link)
🦠 Xiao-Wei Wang writes “Elevating the Voice of Science amid COVID-19 – A Conversation with Science Editor-in-Chief and 1991 Packard Fellow, Holden Thorp” for the David and Lucile Packard Foundation. An interesting interview of the Editor-in-Chief of a journal which has provided some of the best news coverage and papers since the start of the pandemic. Also talking about philanthropy’s role on the advancement of science, the underinvestment in public health and why science still needs to be vigilant as revealed during the crisis:
“it [the crisis] has also revealed that 25% of Americans have been convinced by bots and cable news that they shouldn’t trust science.”
Science is always work in progress, and its interface with the public and policy makers will need to improve to make sure that this 25% numbers goes down and not up. (Link)
📊 A picture is worth a thousand words: Global (🌎) and local (with relevant flag) visualisation and forecasting tool
🦠 “Science Forum: SARS-CoV-2 (COVID-19) by the numbers” (Link)
“The COVID-19 pandemic is a harsh reminder of the fact that, whether in a single human host or a wave of infection across continents, viral dynamics is often a story about the numbers. In this article we provide a one-stop, curated graphical source for the key numbers (based mostly on the peer-reviewed literature) about the SARS-CoV-2 virus that is responsible for the pandemic. The discussion is framed around two broad themes: i) the biology of the virus itself; ii) the characteristics of the infection of a single human host.”
🇺🇸🌎 This model has led accuracy for several weeks in the US. It also does projection for Europe and Rest of the World. (Link)
🇺🇸 “Is your community ready to reopen?”: A map of the US (50 states and 2,100+ counties) looking at reopening risks with metrics around 3 criteria: 1. Is COVID in retreat? 2. Are we testing enough? 3. Are our hospitals ready? (Link)
🌎The Financial Times (visualisation) has a data tracking page which is in front of the paywall, looking at cases and fatality curves for selective countries and metropolitan areas/region. It is not as extensive as the Madlag link below, where you can see static as well as animated images for a greater number of individual countries. (Link)🇺🇸 The Johns Hopkins University resource center was the first one I used back in January they have now made available in their latest iteration a county by county dashboard in the US including information about health capacity, insurance coverage, ethnicity and age breakdown of the populatio (Link)
💊 The "Map of Hope" provides a geographical overview of planned, ongoing and completed clinical trials. It is put together with data from WHO Clinical Trials Search Portal by the Heidelberg Institute for Geoinformation technology. (Link)
🌍 MRC Centre for Global Infectious Disease Analysis started to publish weekly death estimates for countries (Link)
🇺🇸 The US Center for Disease Control and Surveillance (CDC) publishes “A Weekly Surveillance Summary of U.S. COVID-19 Activity” (Link)
Google has published a new website to “See how your community is moving around differently due to COVID-19”. They have a lot of data to do so… (Link)
🌎 Country by Country Curves: This is a GitHub made by my friend Francois Lagunas. He has written a script to scrape deaths and number of cases in order to visualise the rate of growth on a logarithmic scale. Great resource (Link)


